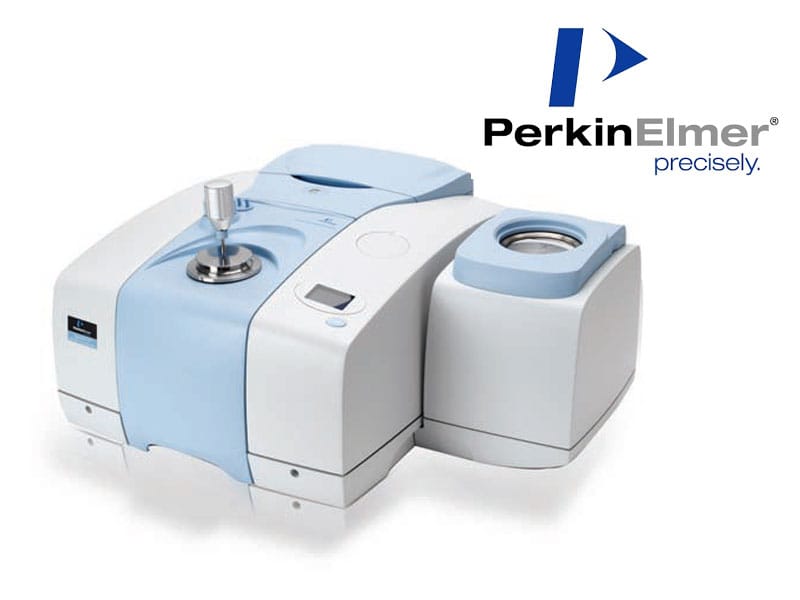
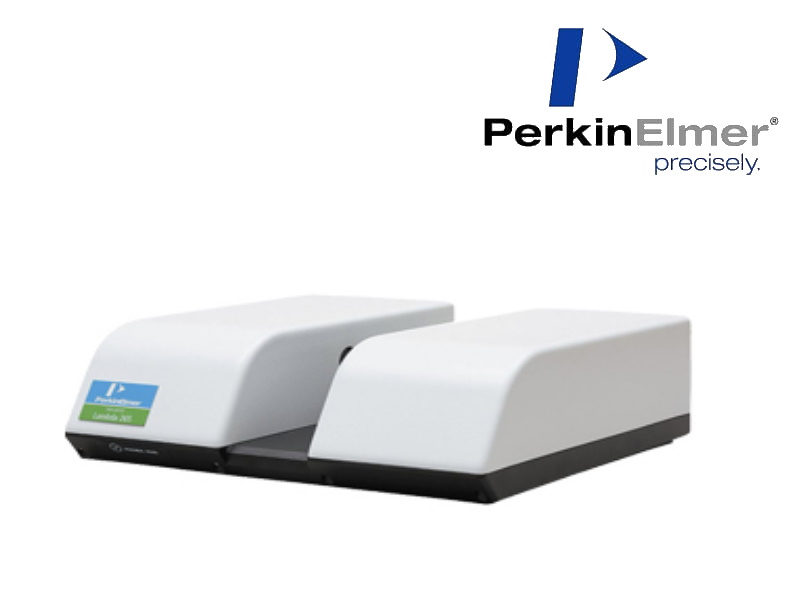
FTIR spectrometer

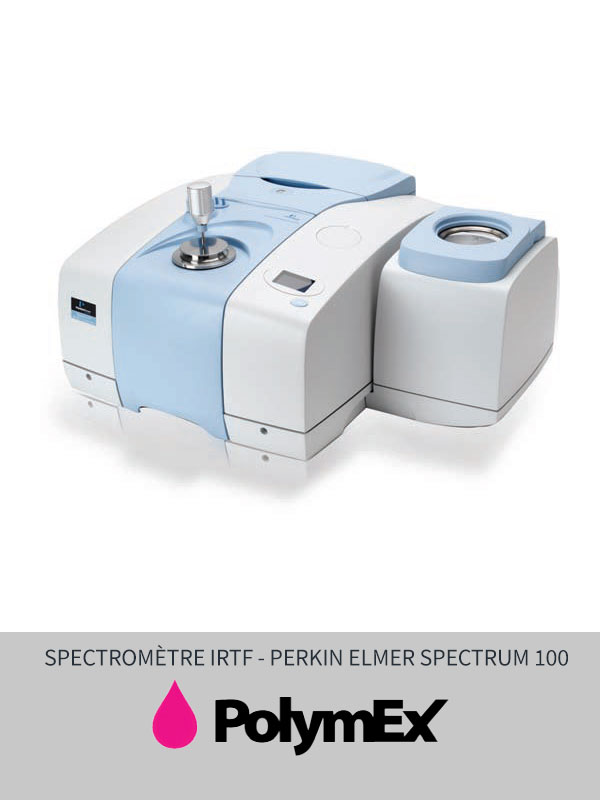
Spectrometer : Perkin Elmer Spectrum 100
Detector : DTGS
Spectral range : 7000 to 400 cm -1
Analysis mode: Transmission, Reflection
Sampling accessory
: ATR diamond, KBr pad, ZnSe support
Resolution : 16 to 1 cm- 1 .


Application areas

  • Structural identification of polymer matrices, raw materials and residues,
  • Study of aging and degradation of polymers
  • Quantitative analyzes in transmission


SPECTROMÈTRE IRTF PERKIN ELMER SPECTRUM 100

Principle

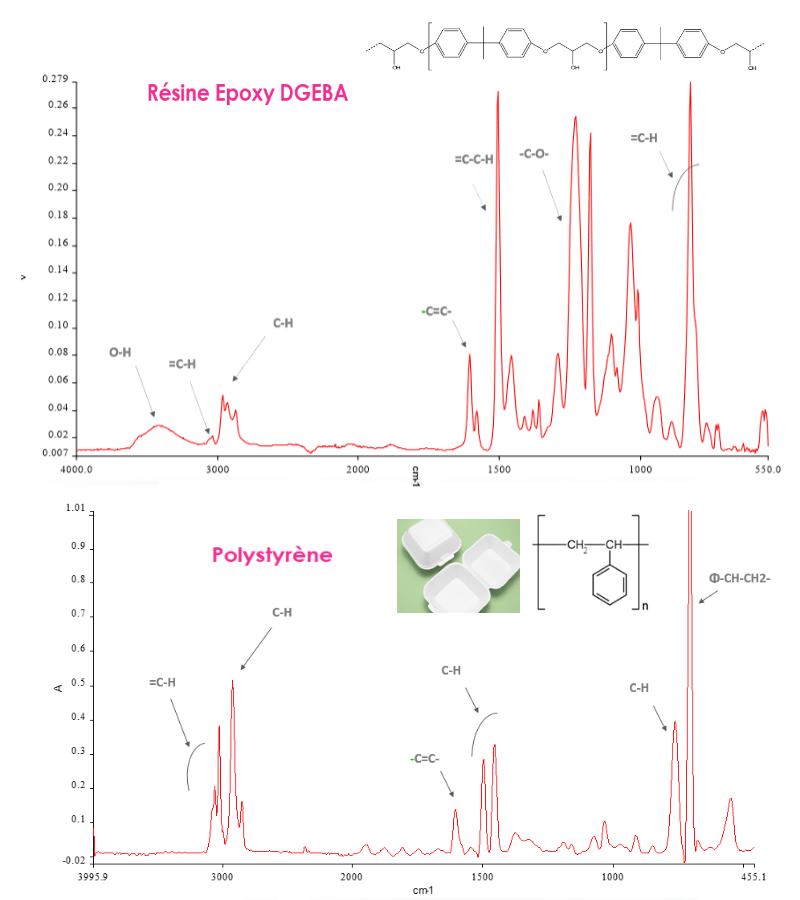
This spectral analysis makes it possible to know the nature of the covalent bonds present in the sample.

Each of them (for example carbon-oxygen) will be characterized by one or more bands on the IRTF spectrum obtained.

The interpretation of these bands in relation to their intensity, their wavelength, their shape as well as the comparison with a library of reference spectra (more than 15,800 spectra), will make it possible to highlight at least the chemical family (ester, acid, urethane ...) and very often the exact nature of the compound analyzed.


Advantages

Quick & easy,
Non-destructive technique,
Requires little sample (a few µg),
No sample preparation,
Very sensitive.


Disadvantages

No separation (response on a single spectrum)
Identification of chemical functions allowing the nature of the sample to be determined, but difficulty in sometimes tracing the exact structure


Application examples

Styrene content of SBR,
ECSS-Q-ST-70-05-C: Detection of surface organic contamination
EN 6042: Analysis of pre-pregs – Aerospace series.
Compliance check
Structural identification of a polystyrene


Analyse IRTF

OUR ANALYTICAL EQUIPMENT

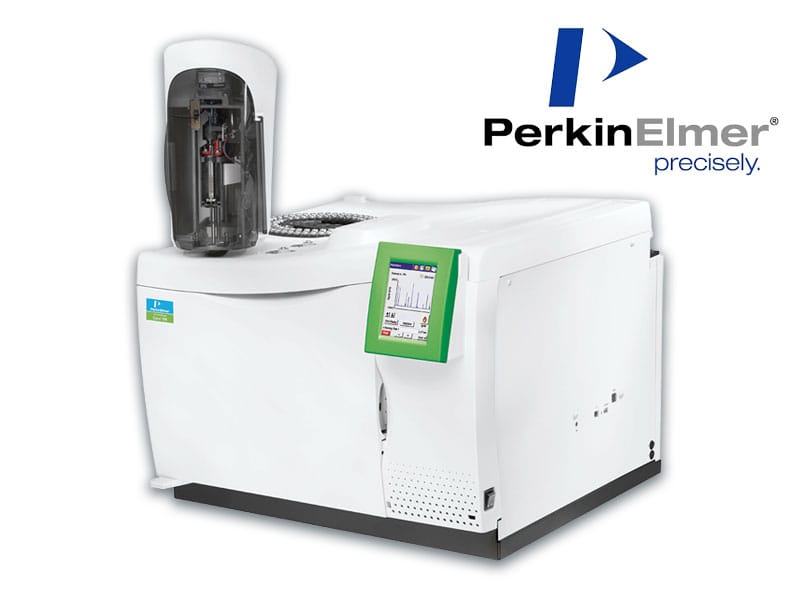
During injection into the GC, all organic compounds will be separated by the chromatographic column and then identified by the MS (mass..
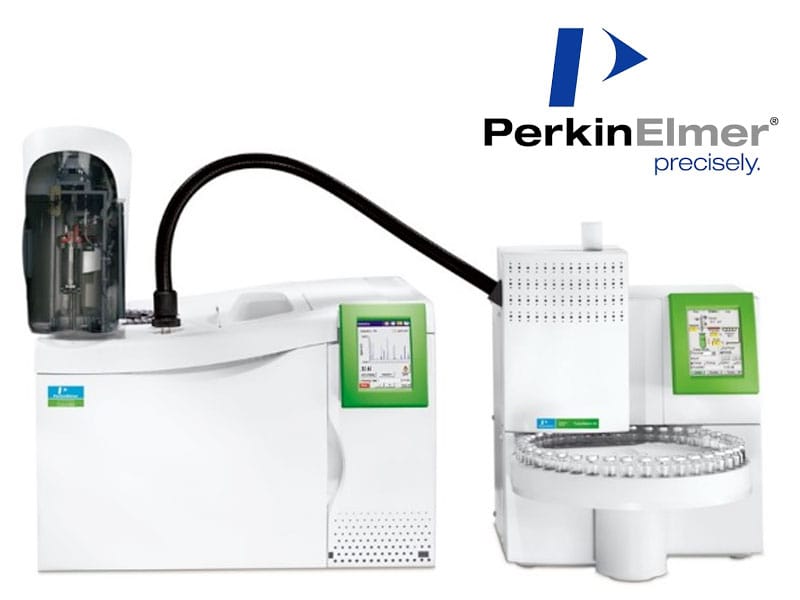
GCMS-FID

GCMS-FID

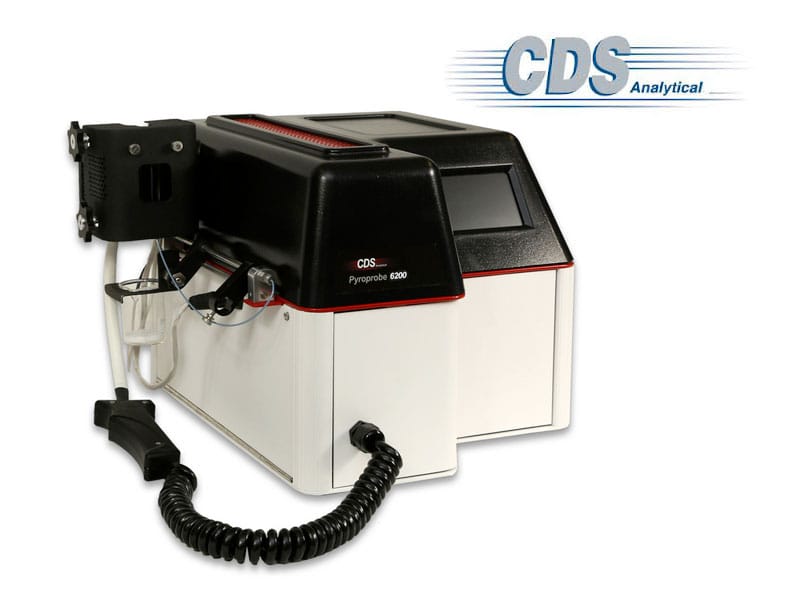
The sample is directly injected into the pyrolyzer oven heated to 550 ° C using a solid syringe. This instantly causes the fragmentation of..
PYROLYZER

PYROLYZER

During the injection into the LC, all the semi-volatile organic molecules will be separated by the chromatographic column and then detected..
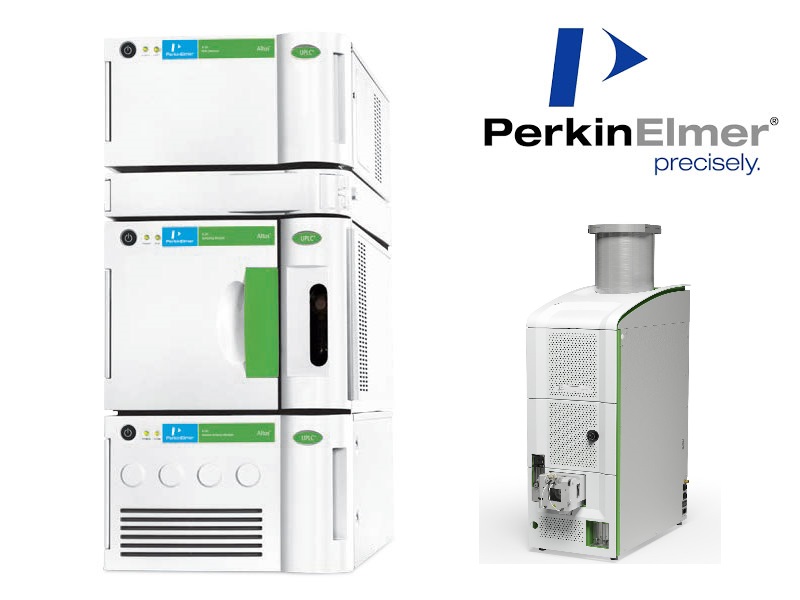
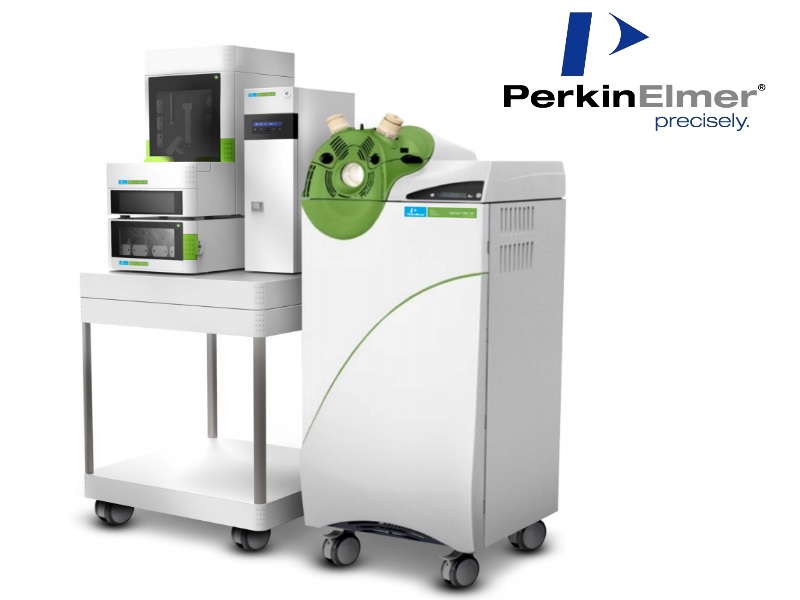
UPLC/UV/TOF-MS

UPLC/UV/TOF-MS

During the injection into the LC module, all the semi-volatile organic molecules will be separated by the chromatographic column and then..
UPLC-MS-MS

UPLC-MS-MS

The HeadSpace / GCMS technique does not require preparation. The sample is placed in a gas tight vial and hermetically sealed using a..
HEADSPACE/GCMS

HEADSPACE/GCMS

This spectral analysis makes it possible to know the nature of the covalent bonds present in the sample. Each of them (for example..
IRTF SPECTROMETER

IRTF SPECTROMETER

A SEM (Scanning Electron Microscope) uses an electron beam to obtain enlarged images of very good resolution. It can also be used to..
SEM/EDX

SEM/EDX

CENTRIFUGE

CENTRIFUGE

Certain molecules form by reaction colorimetric complexes having maximum absorption in UV-Visible. The color of these complexes is read..
UV-VIS SPECTROMETER

UV-VIS SPECTROMETER